Instrumenting And Monitoring Spring Boot 2 Applications
In this post, I try to introduce you some basic concepts of an instrumentation of a Spring Boot 2 application with tools such as Micrometer, Prometheus, Grafana. There are 3 main phases while you’re instrumenting an application, first, one is producing metrics in the application(Micrometer), the second one is gathering these metrics to persist(Prometheus) and the third one is monitor these metrics(Grafana).
What’s Software Instrumentation?
According to Wikipedia, instrumentation, in terms of computer programming, is;
In the context of computer programming, instrumentation refers to an ability to monitor or measure the level of a product’s performance, to diagnose errors and to write trace information…
With instrumentation, we can measure product performance with metrics such as HTTP request count/duration/latency, async long/short term job processing time, the processing time for different business workflows, memory/CPU usage statistics of the process, database connection pool statistic etc. Metrics for error can be a count of some events, count of message logging levels(error, warning etc.).
Before I met with the Prometheus, I knew only metrics and monitoring are used just for system resource usage(machine-centric) not direct performance or status indicator of an application different components or parts. And the tool that I heard mostly is Nagios because of usage in our customer.
Software instrumentation grab my attention first when I try something with Peter Bourgon go-kit microservice framework. In this framework instrumentation is one of the central ideas for an application, and you can easily use decorators for instrumentation enabled applications. I think, for microservice architecture, instrumentation of services is a must have feature. Also, a blog post from Peter Bourgon is useful for the distinction between logging and instrumentation.
Benefits of Software Instrumentation
If you make performance test, with instrumentation, you can easily understand the performance bottlenecks in your application.
At production environment, your application no longer will be a black box, you can continuously observe the application performance, usage, errors etc. statistics. And also you can set up an alert mechanism according to these metrics.
For some customer, you may not have access right to the production environment, if an application has a problem, understanding this problem can be a big challenge because sometimes situation becomes as you don’t have authorization but you are responsible to fix the problem!
Another benefit is the separation of concerns, maybe you can produce some metrics within your application but this is not a responsibility of your application, with instrumentation business logic and operational implementations can be separated.
Metric Types
Prometheus supports four different metric types, these are counter, gauge, histogram, summary. I quote these metrics’ definition from Prometheus documentation, you can read detailed information from prometheus web site.
Counter
A counter is a cumulative metric that represents a single monotonically increasing counter whose value can only increase or be reset to zero on restart. For example, you can use a counter to represent the number of requests served, tasks completed, or errors.
Gauge
A gauge is a metric that represents a single numerical value that can arbitrarily go up and down.
Gauges are typically used for measured values like temperatures or current memory usage, but also “counts” that can go up and down, like the number of running goroutines.
Histogram
A histogram samples observations (usually, things like request durations or response sizes) and counts them in configurable buckets. It also provides a sum of all observed values.
Summary
Similar to a histogram, a summary samples observations (usually, things like request durations and response sizes). While it also provides a total count of observations and a sum of all observed values, it calculates configurable quantiles over a sliding time window.
Micrometer
Micrometer is a metrics instrumentation library for JVM-based applications. You can produce metrics within your application without any dependency to your monitoring system. Micrometer has built-in support for monitoring systems such as Prometheus, Netflix Atlas, CloudWatch, Datadog, Graphite, Ganglia, JMX, Influx/Telegraf, New Relic, StatsD, SignalFx, and Wavefront.
With Spring Boot 2, Micrometer is the default instrumentation library, so there is no need to use any monitoring system dependent client library to produce application level metrics.
SpringBoot Actuator & Micrometer Metrics
I’m going to use the Oliver Gierge’s spring-restbucks application as a sample application. I forked this application to my GitHub account and commit the changes that I made for instrumentation to this repo.
spring-boot-actuator module provides features, such as auditing, health check, metrics gathering etc., to help you monitor and manage your application. Adding dependency to spring-boot-starter-actuator in your pom.xml file, you can enable actuator features in your application.
<dependency>
    <groupId>org.springframework.boot</groupId>
    <artifactId>spring-boot-starter-actuator</artifactId>
</dependency>
Actuator module exposes some endpoints to monitor your application, one of them is metrics endpoint, this endpoint is used to expose system and application level metrics via HTTP. metrics endpoint is not enabled by default to the web, you can enable the expose of this endpoint by adding below property to application property file;
management.endpoints.web.exposure.include= metrics
After these settings and restarting your application, you can access your metrics for spring-restbucks application from the endpoint; http://localhost:8080/actuator/metrics. You can see the JSON result when this URL is requested from the command line with httpie command line HTTP client. This JSON data is the name of default metrics that are exposed by Micrometer by default. There 56 default metrics related to JVM internals(memory usage, garbage collection, threads etc.), Tomcat(sessions, HTTP request/response, errors etc.), database connection pool, Logback, process(start time, CPU usage) and system(CPU count, system load(not on Windows), CPU usage etc.).
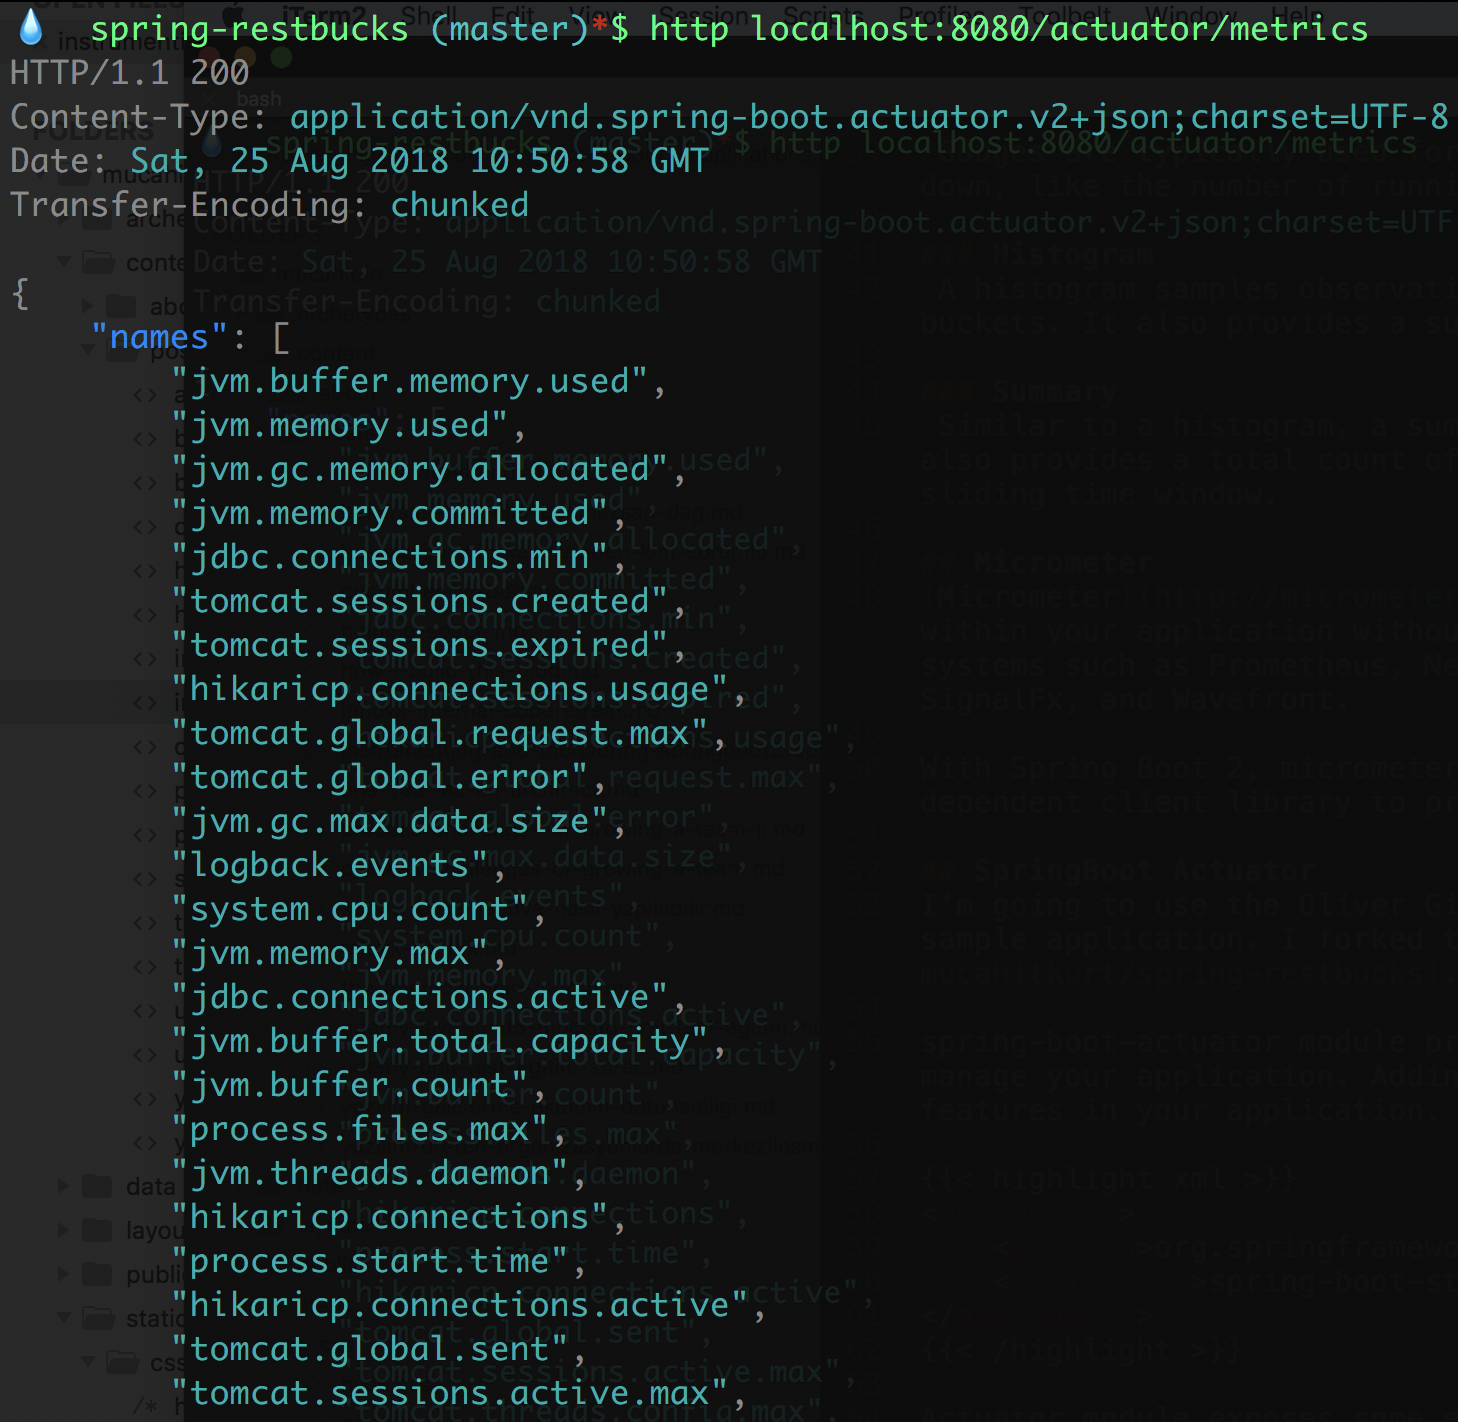
Micrometer default exposed metrics
To access the value of specific metric you should make another HTTP request with metric name, for instance, to access the value of jvm.memory.used metric, you should use the URL, http://localhost:8080/actuator/metrics/jvm.memory.used. Spring-restbucks application in my machine used about 275MB memory.
Actually, this value is the sum of 6 different JVM memory usage metrics, you can see these metrics at below image under the tag name “id”, such as Compressed Class Space, PS Old Eden, Ps Survivor Space etc. Also, these metrics are divided into two different categories, heap, nonheap under the tag name “area”. Some monitoring system uses the name “dimension” instead of “tag”, both of them serve for the same thing.
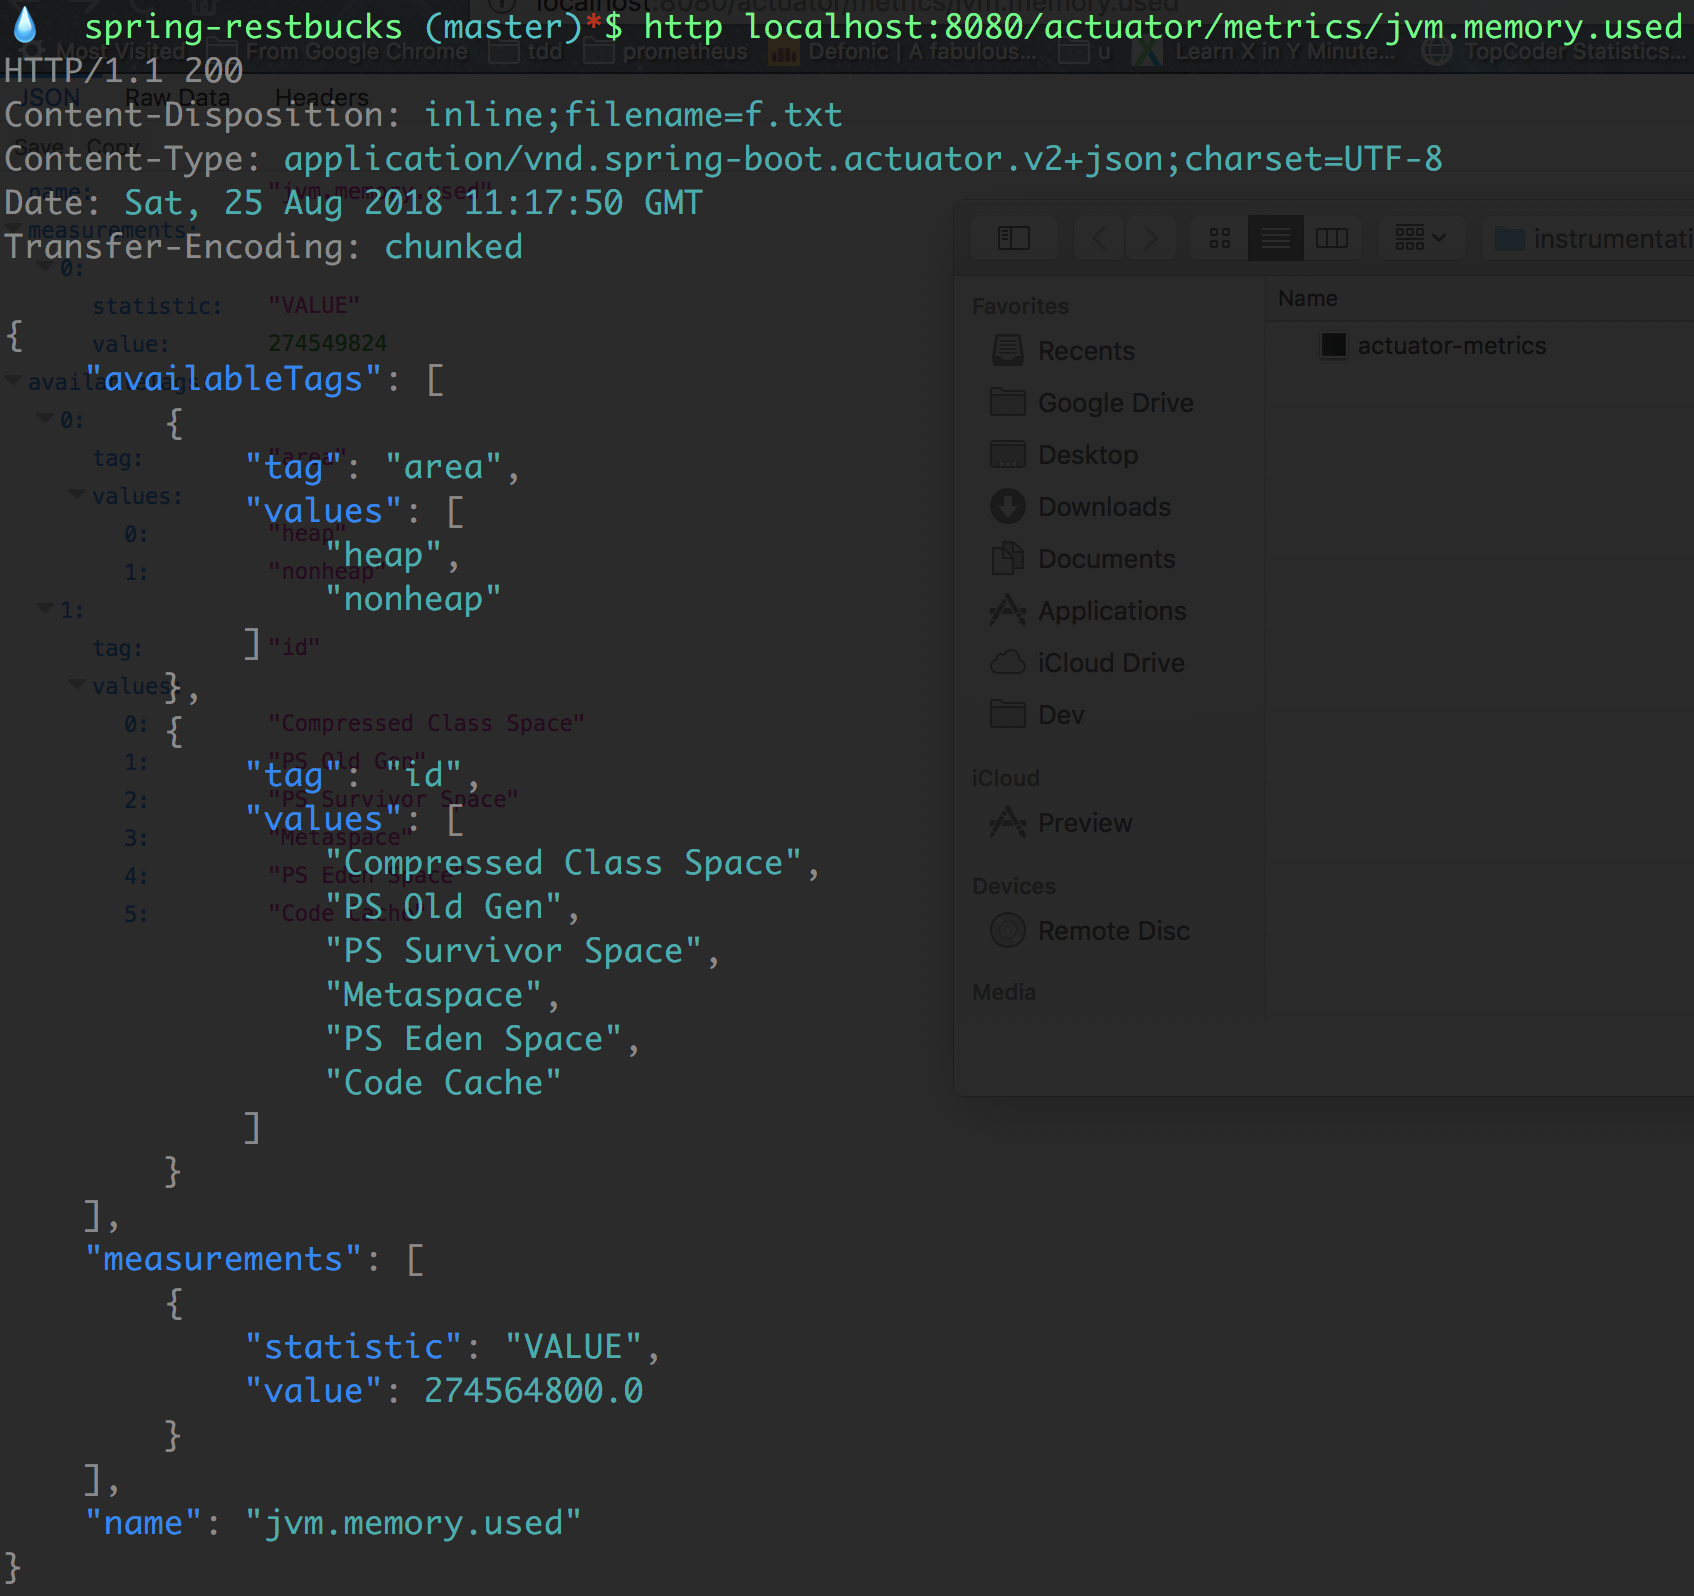
Value of jvm.memory.used metrics
To access these tagged metrics values you should use URLs like;
http://localhost:8080/actuator/metrics/jvm.memory.used?tag=area:heap,
http://localhost:8080/actuator/metrics/jvm.memory.used?tag=area:heap&tag=id:PS%20Eden%20Space
Adding Custom Metrics
Micrometer has two concepts to produce metrics, one of them is Meter that’s the interface for different metric types such as a counter, timer, histogram etc. The other one is MeterRegistry that’s responsible for creating and keeping meters(in memory).
Spring autoconfigures a registry for you, if you use specific monitoring tool such as Prometheus, then Spring autoconfigure PrometheusMeterRegistry, by default Micrometer uses a SimpleMeterRegistry. If you add a dependency to MeterRegistry one of your Spring-managed bean, Spring auto wires this dependency for you. Also if you can’t use dependency injection mechanism you can register your metrics with the static global registry mechanism of the Micrometer. Metrics that are registered via global registry automatically exposed to your specific registry(the Spring-managed one).
In spring-restbucks application to create a counter metric to count the created order, add a JPA entity listener, and whenever an order entity is persisted then increase the counter;
public class OrderEntityListener {

    @PostPersist
    public void handleAfterCreate(Order order) {
        final Counter counter = Metrics.counter("entity.count", "type", "order");
        counter.increment();
    }
}
Name of the metric is entity.count and has a tag type with value order. Change the Order class and add @EntityListeners to enable an entity listener;
@EntityListeners(OrderEntityListener.class)
@Entity
@Getter
@ToString(exclude = "lineItems")
@Table(name = "RBOrder")
public class Order extends AbstractAggregateRoot {
...
After restarting the spring-restbucks application, you can see the value of entity.count metric as 2, because the application creates two orders after starting(OrderInitializer). To see the value of entity.count metrics with httpie, execute http :8080/actuator/metrics/entity.count command(you can also use a browser with the URL adding ‘localhost’ to the head) you should see the below JSON data;
{
    "availableTags": [
        {
            "tag": "type",
            "values": [
                "order"
            ]
        }
    ],
    "measurements": [
        {
            "statistic": "COUNT",
            "value": 2.0
        }
    ],
    "name": "entity.count"
}
If you send a JSON order request to URL http://localhost:8080/orders to create a new order with httpie from the command line; http :8080/orders < order.json
The content of the order.json file;
{
  "location": "TAKE_AWAY",
  "lineItems": [
    {
      "name": "Java Mocha",
      "quantity": 1,
      "milk": "Low-fat",
      "size": "Large",
      "price": "EUR4.20"
    }
  ]
}
The new value of the entity.count will be 3.
To make the adding new orders work, I have to make some changes at class JacksonCustomizations, you can see these changes on my GitHub account.
Measuring count of payment expected orders can be done with a gauge metric because this counter can be increased or decreased. Gauge metrics can be bounded to a function call. At spring-restbucks application, you can register a gauge metric in the OrderInitializer class. This metric can be bounded to OrderRepository.findByStatus method, to measure the count of orders with the status payment expected. OrderInitializer is a Spring bean so you can use dependency injection to access the MeterRegistry. Below code register the gauge entity.status.count with tag values type=Order and status=PAYMENT_EXPECTED in the OrderInitializer.init method;
registry.gauge("entity.status.count", Arrays.asList(Tag.of("type", "order"), Tag.of("status", Order.Status.PAYMENT_EXPECTED.toString())),
                orders, orderRepository -> orderRepository.findByStatus(Order.Status.PAYMENT_EXPECTED).size());
Initial value of entity.status.count{type=Order, status=PAYMENT_EXPECTED} is 2, when a new order is added this value is increased by one, when a order is paid with the command http PUT http://localhost:8080/orders/<order_id>/payment number="1234123412341234", this value is decreased by one.
Prometheus
You produced metrics with Micrometer, these metrics are continuously changed and are kept in memory by the MeterRegistry. If your application is restarted all metrics are also reset. To persist and observe these metrics with the progress of time you should use a monitoring tool.
Prometheus is an open source tool for instrumenting and monitoring metrics. It works in a pull-based manner, makes HTTP requests to your metric endpoint with the pre-determined time intervals(default 10seconds), and store these metrics in its own time-series database. Prometheus also provides a GUI to make queries over these metrics with its own query language PromQL. It provides basic graphics to visualize metrics. Prometheus also has an alert plugin to produce alerts according to metrics values.
Prometheus has its own formats for metrics, it’s not the same as the Micrometer format so Micrometer use a special PrometheusMeterRegistry to expose metrics in Prometheus format. To access the Prometheus metrics you should do two things;
First, add a dependency to micrometer-registry-prometheus in pom.xml file;
<dependency>
    <groupId>io.micrometer</groupId>
    <artifactId>micrometer-registry-prometheus</artifactId>
</dependency>
Second, enable prometheus endpoint in application.properties file;
management.endpoints.web.exposure.include=metrics,prometheus
After restarting the spring-restbucks application and hit the URL http://localhost:8080/actuator/prometheus you can see metrics in Prometheus format, something similar to below;
# HELP jvm_gc_max_data_size_bytes Max size of old generation memory pool
# TYPE jvm_gc_max_data_size_bytes gauge
jvm_gc_max_data_size_bytes 2.863661056E9
# HELP hikaricp_connections_acquire_seconds Connection acquire time
# TYPE hikaricp_connections_acquire_seconds summary
hikaricp_connections_acquire_seconds{pool="HikariPool-1",quantile="0.95",} 0.0
hikaricp_connections_acquire_seconds_count{pool="HikariPool-1",} 9.0
hikaricp_connections_acquire_seconds_sum{pool="HikariPool-1",} 0.0
# HELP hikaricp_connections_acquire_seconds_max Connection acquire time
# TYPE hikaricp_connections_acquire_seconds_max gauge
hikaricp_connections_acquire_seconds_max{pool="HikariPool-1",} 0.0
Our metrics are ready to scrape by Prometheus. To install prometheus easily you can use docker installation;
docker run -d -p 9090:9090 -v ~/Dev/Projects/Sandbox/spring-restbucks/prometheus.yml:/etc/prometheus/prometheus.yml prom/prometheus
I didn’t use a docker volume to persist metrics data.
Prometheus configuration is done via a YAML configuration file that’s name is prometheus.yml, for a very basic configuration the content of the file can be;
scrape_configs:
 - job_name: spring-restbucks
   metrics_path: /actuator/prometheus
   static_configs:
   - targets: ['192.168.43.126:8080']
The IP address 192.168.43.126 is my local computer IP address, localhost doesn’t work because of docker usage.
Now if you hit the URL http://localhost:9090/targets you should see the page like below;
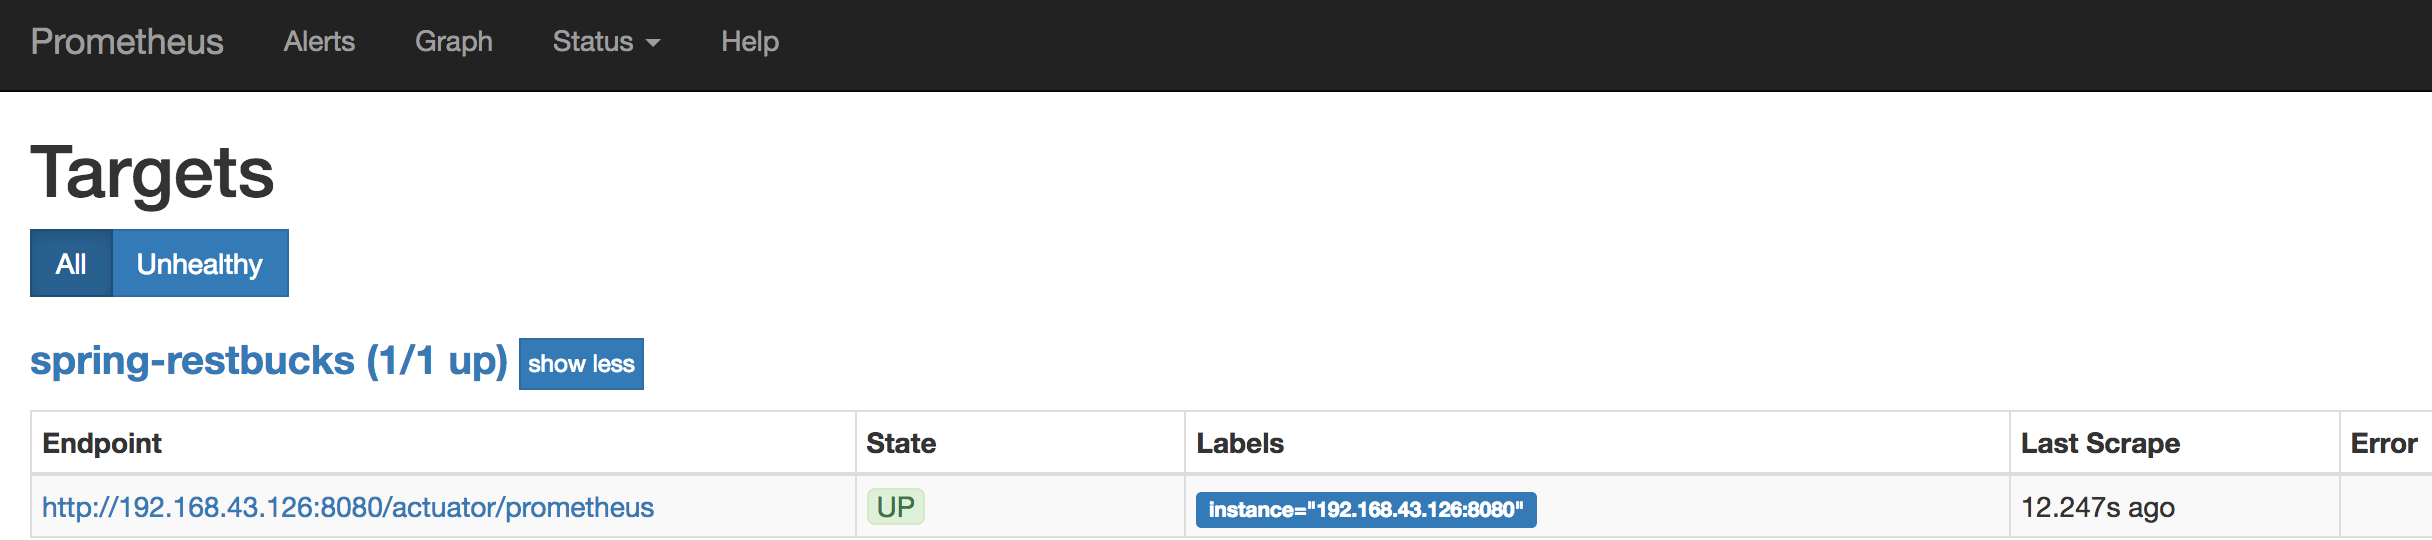
Prometheus Targets Page
And if you hit the URL http://localhost:9090/graph you should see the metric query and graph page. You can query metrics using PromQL. When you query entity.count metric, its name becomes entity_count_total in Prometheus format, you can see its value like below;
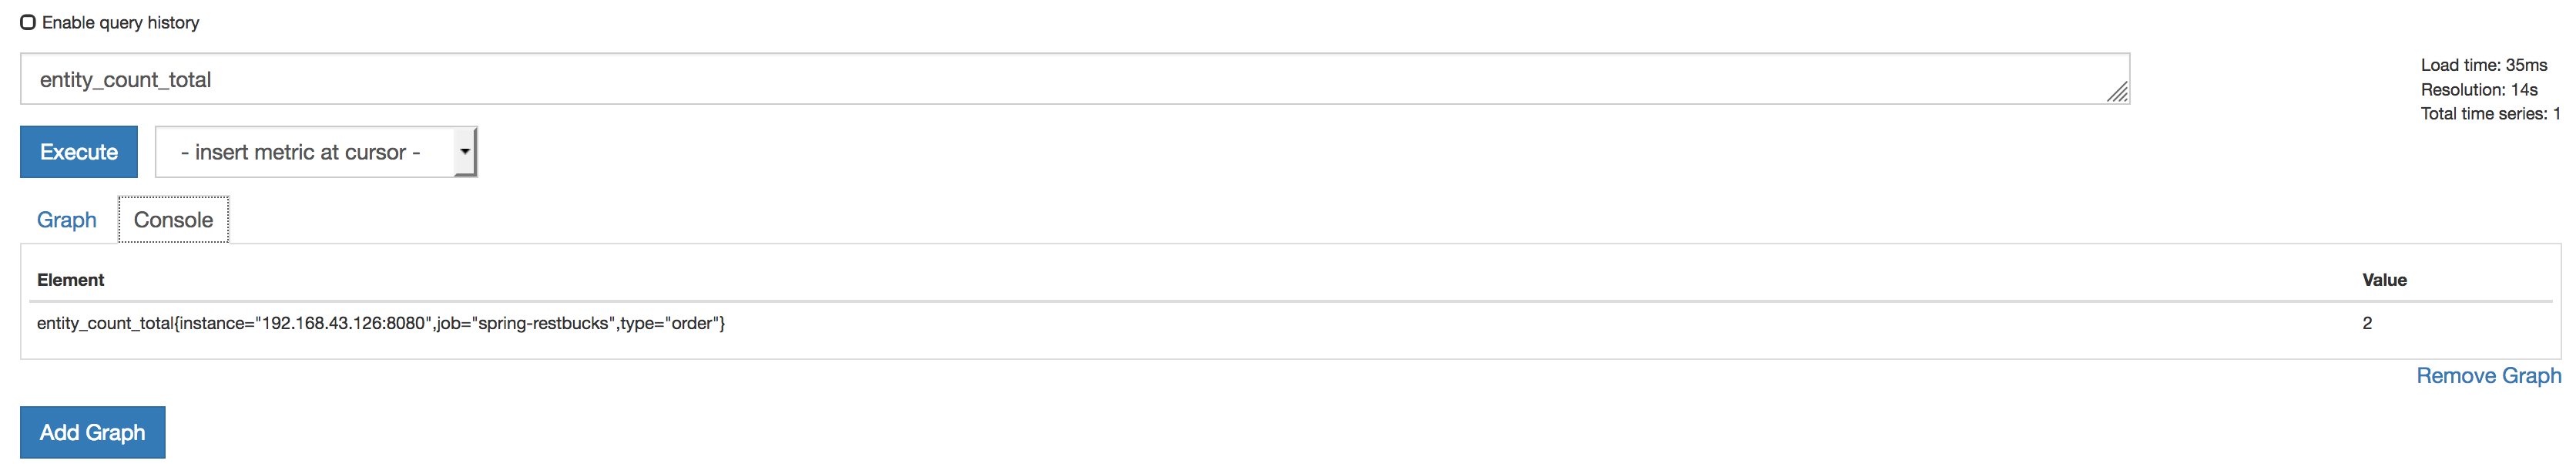
Prometheus Entity Count Query Result
And the graph representation by clicking the Graph tab;
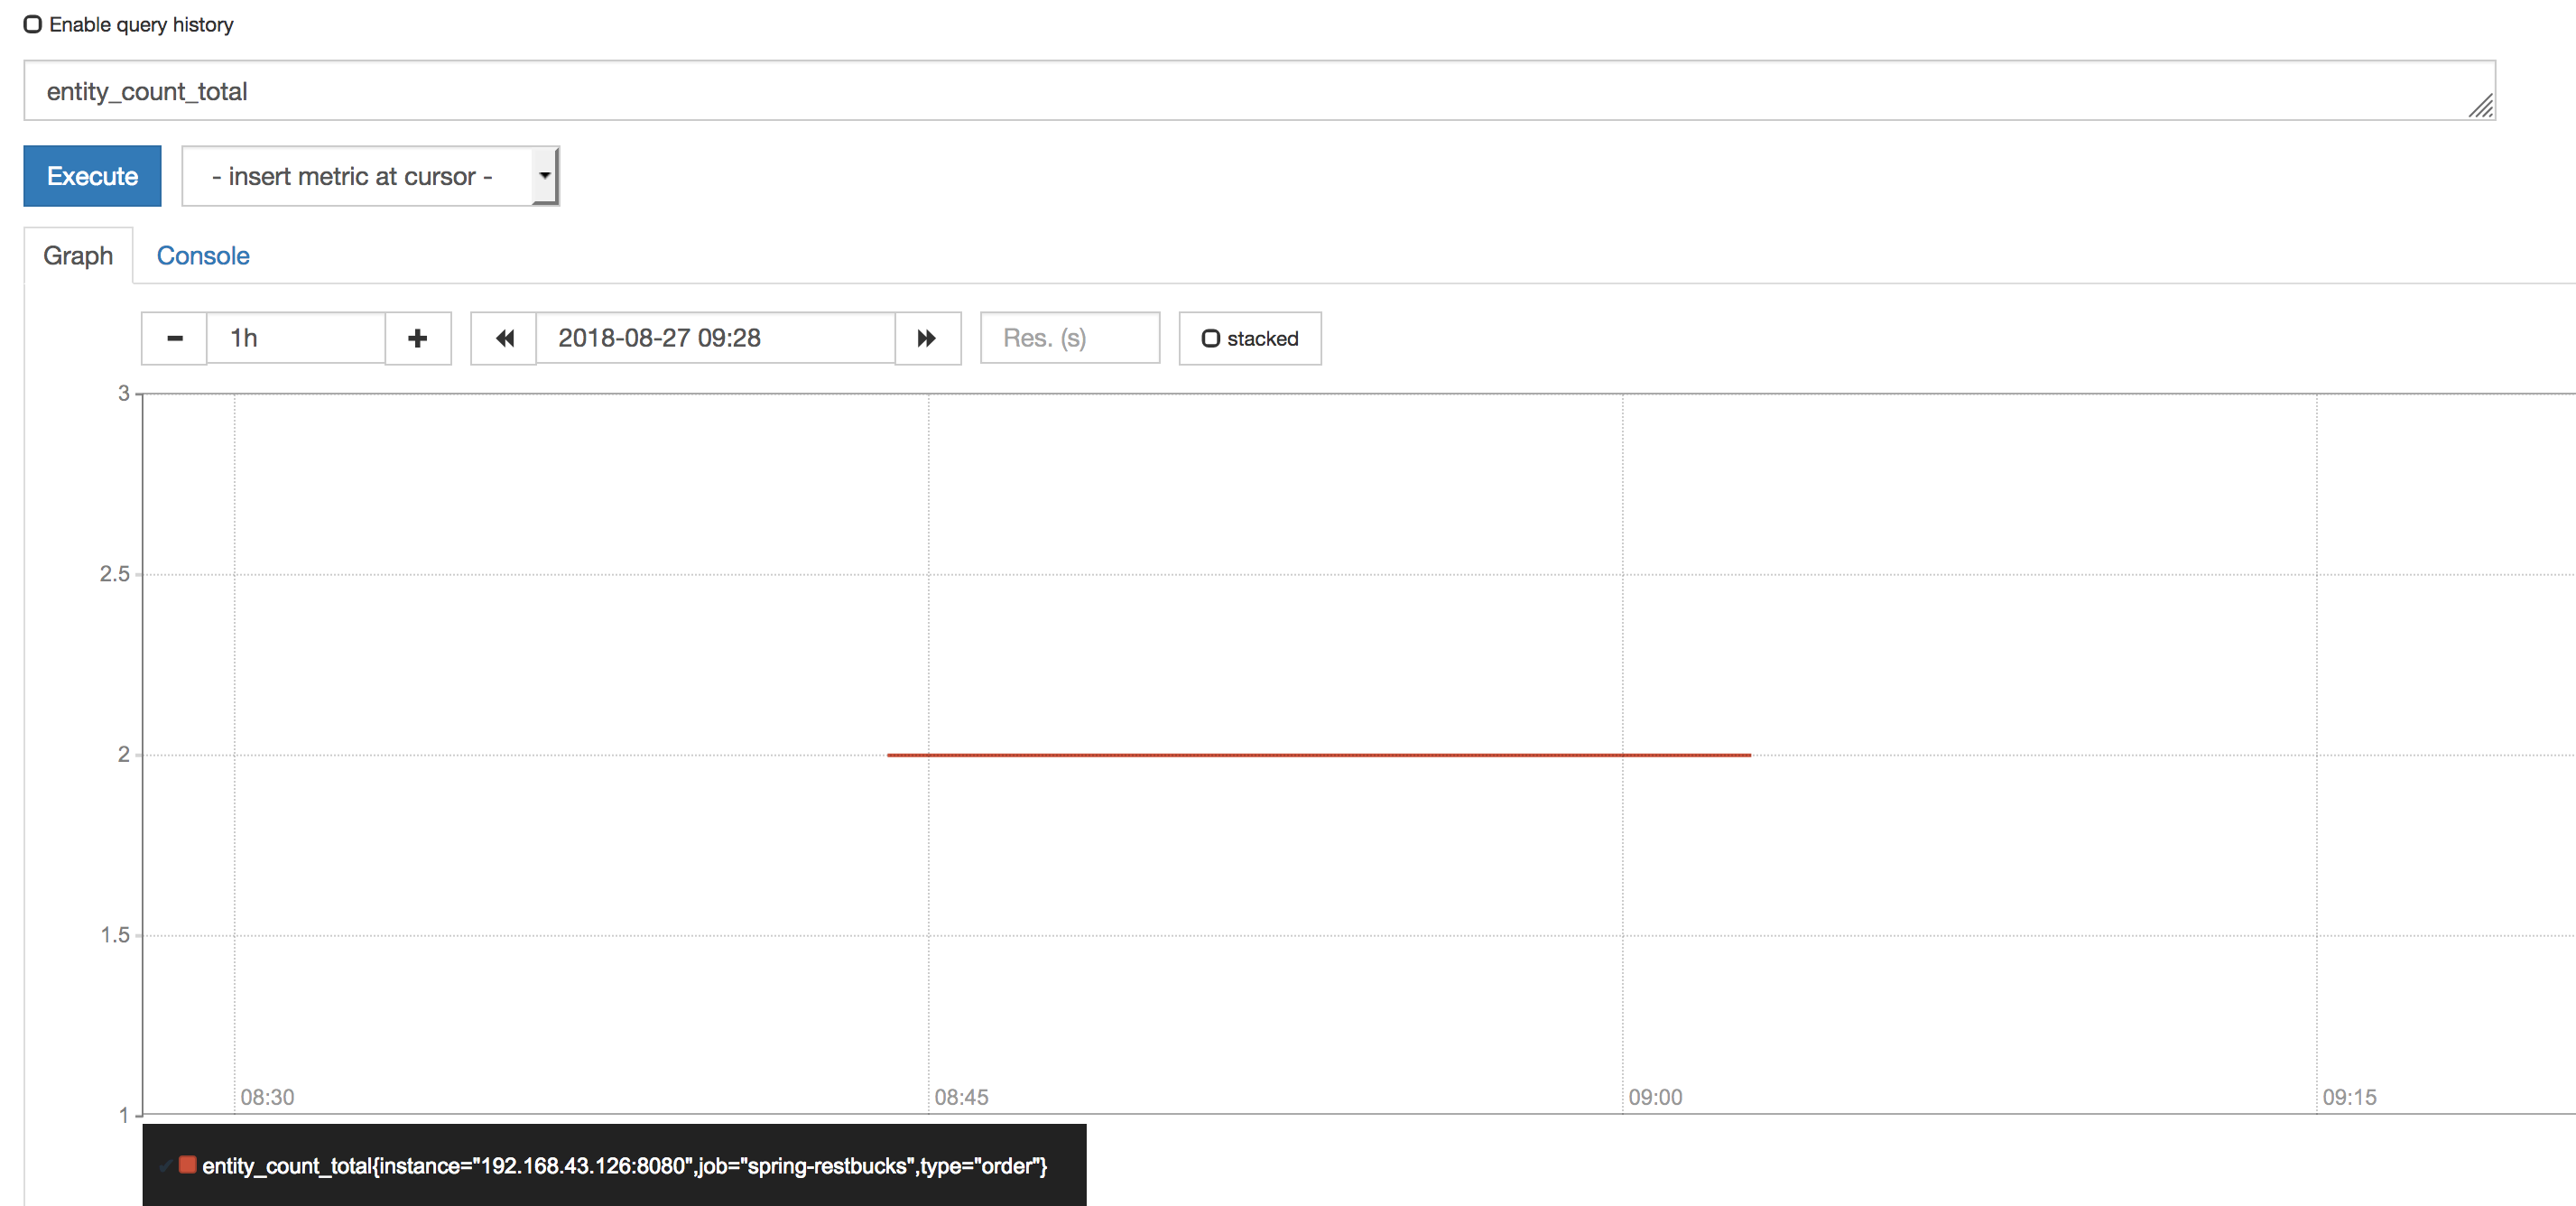
Prometheus Entity Count Graph
Prometheus graph representation is not so powerful because there is another tool that does it well, it’s Grafana.
Grafana
Grafana is an analytics platform for your metrics, it allows you to query, visualize and alert on your metrics. Grafana pulls your metrics from your metric database, it supports many metric databases such as Prometheus, Influxdb, Graphite etc.
You can create your own dashboards or use official and community built dashboards to visualize your metrics.
To install Grafana with docker you can use below docker command;
docker run -d -p 3000:3000 grafana/grafana
When you hit the URL http://localhost:3000 you should see the Grafana login page, the default username/password is admin/admin.
To connect Grafana and Prometheus you should add a Prometheus data source to Grafana like below;
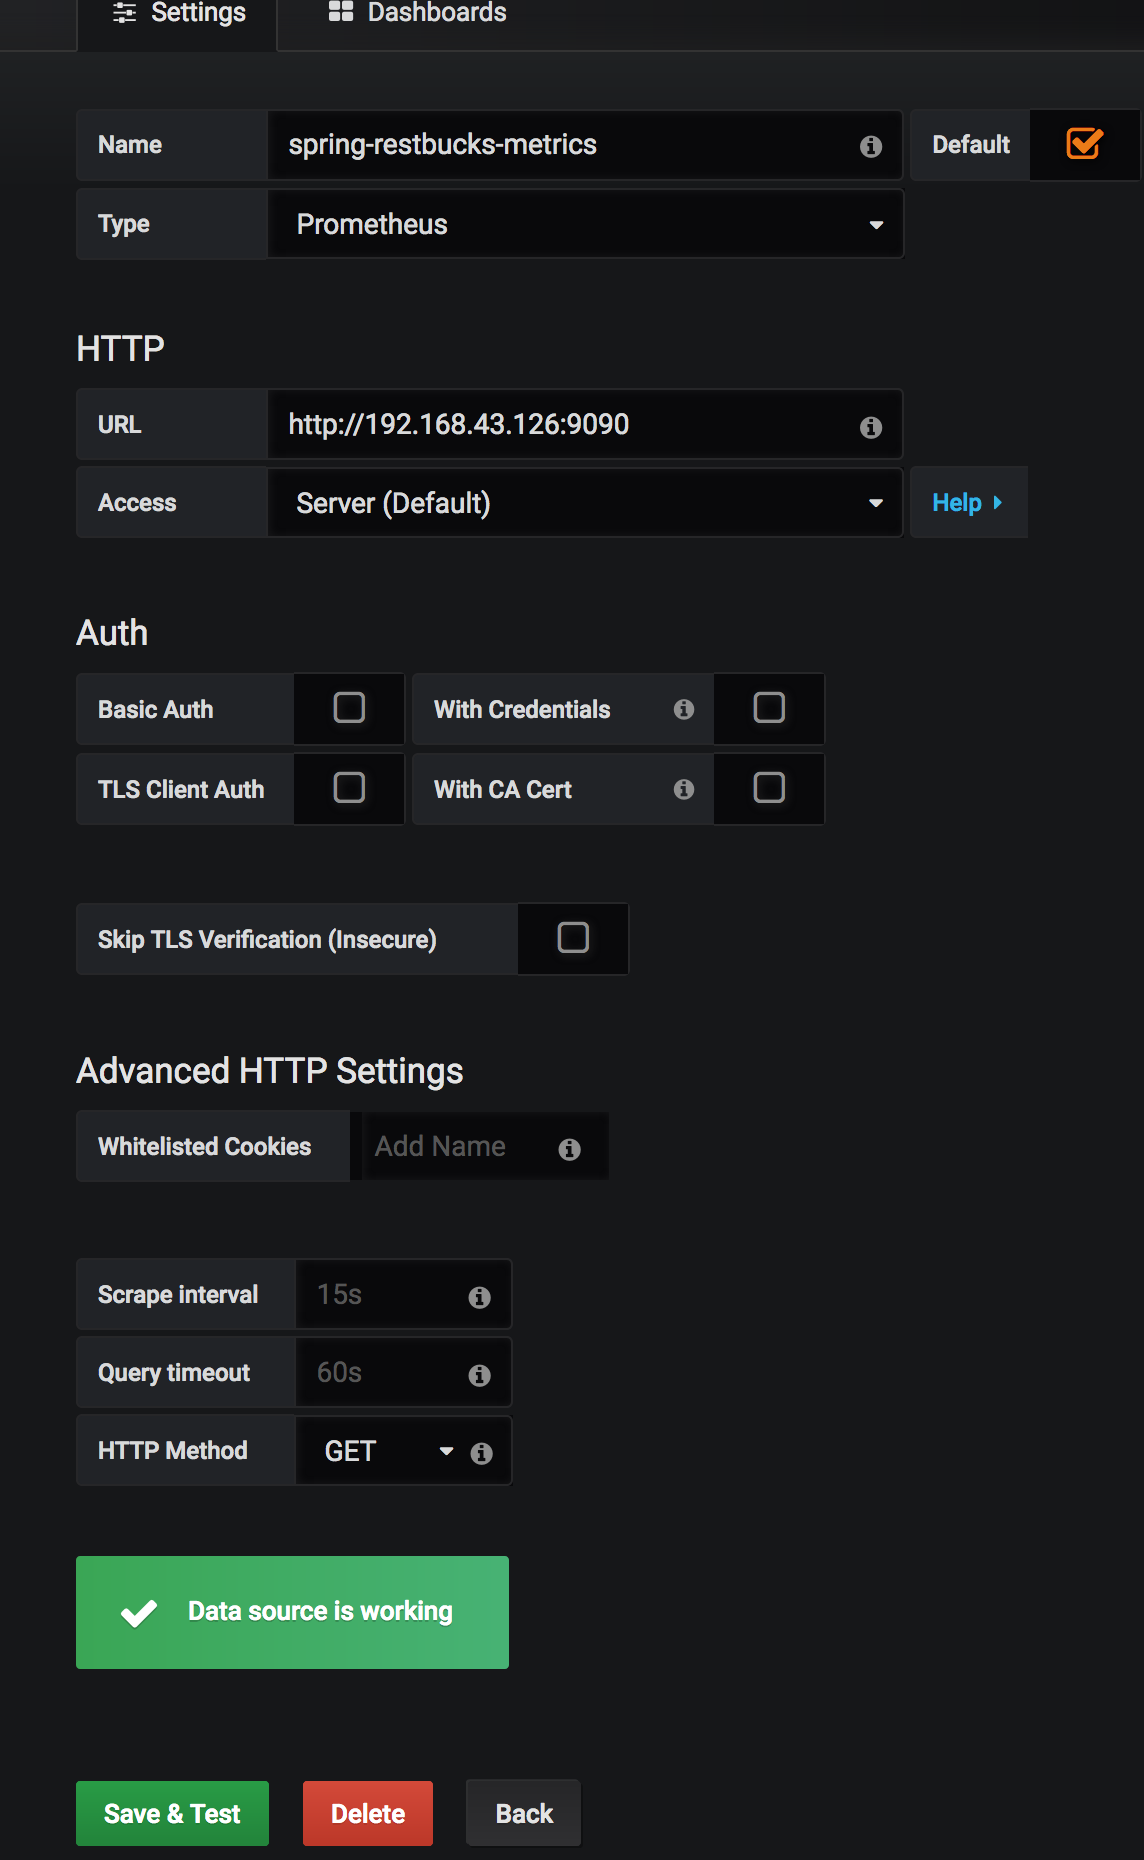
Add Prometheus as Datasource to Grafana
You can try a community dashboard for Micrometer JVM metric from grafana.com. To install this dashboard you should choose [import dashboard option from your grafana] (http://localhost:3000/dashboard/import) and copy the ID of the Micrometer JVM metric dashboard. After clicking ‘load’ you should choose the Prometheus data source like below;
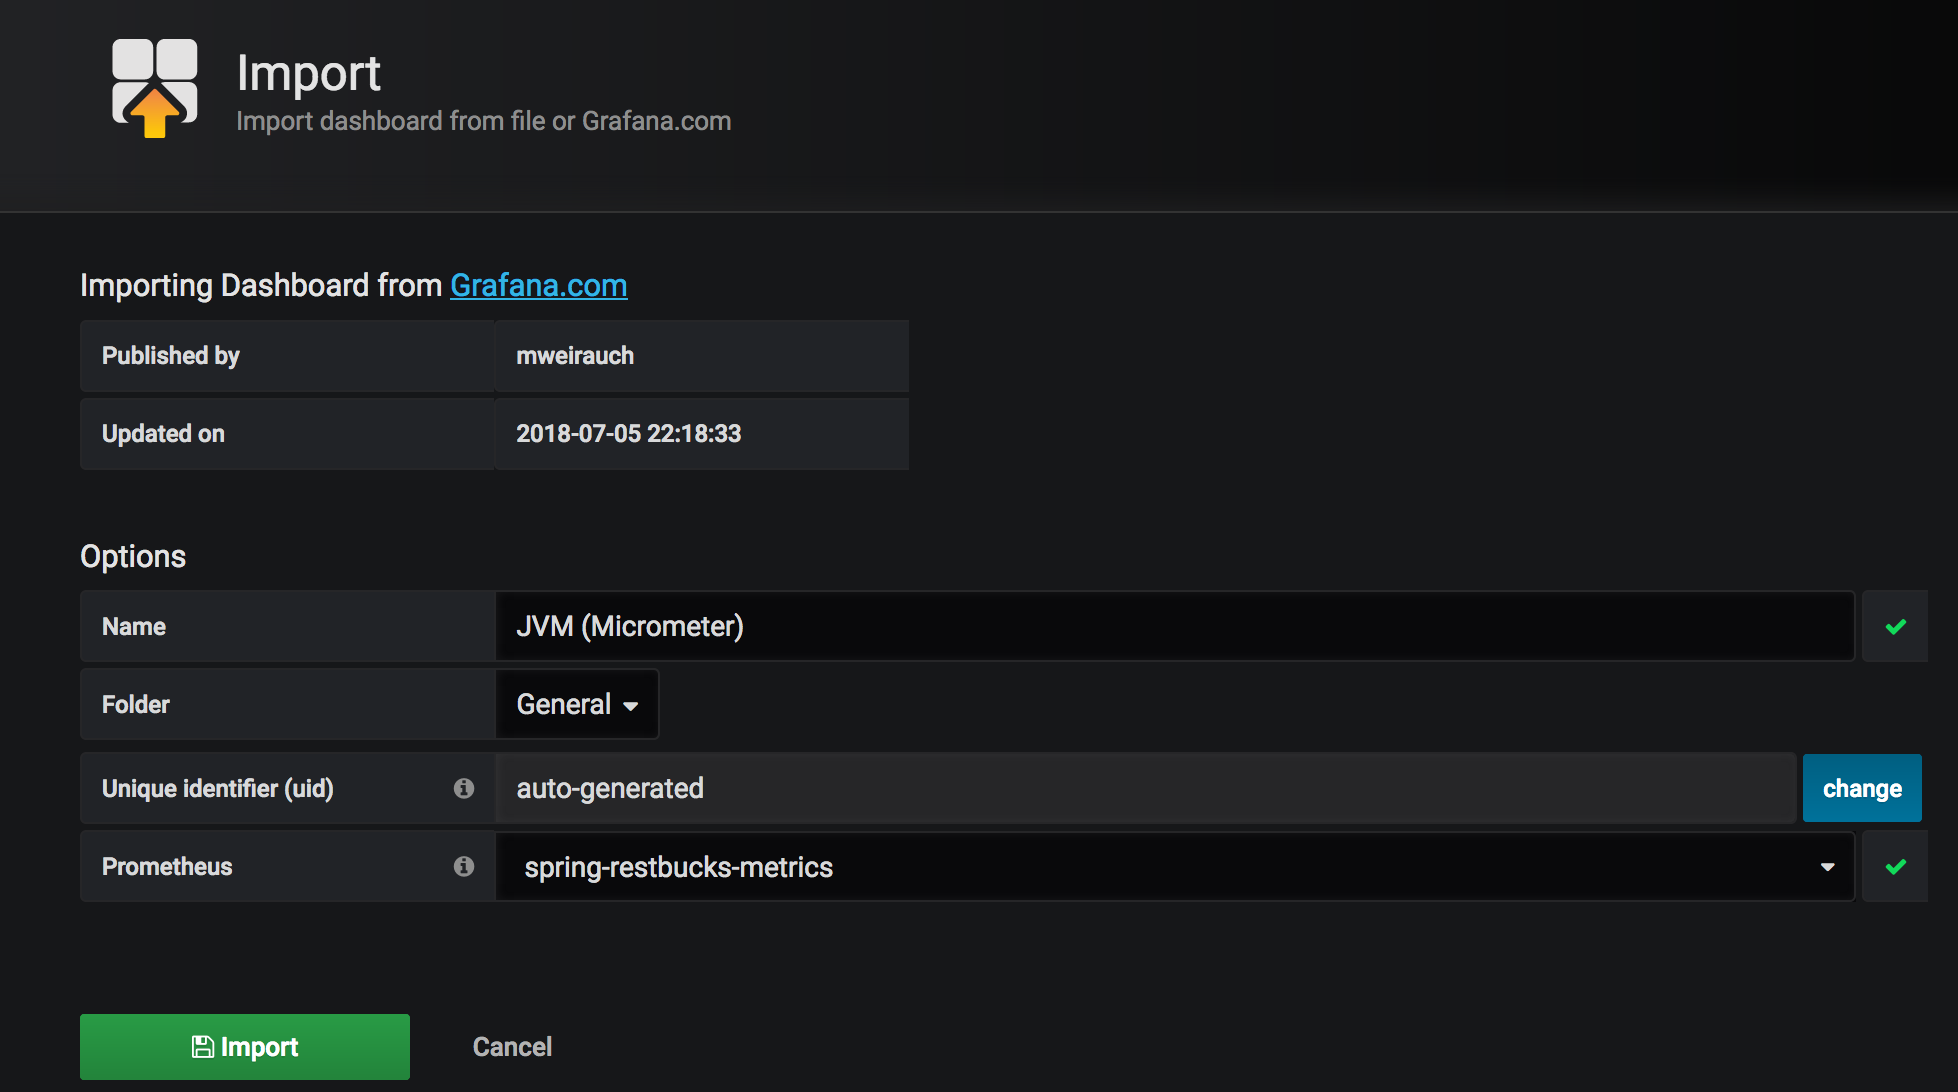
Add Micrometer JVM Metrics Dashboard to Grafana
After importing dashboard your JVM metrics dashboard is ready with many useful panels and started to pull your metrics from your Prometheus;
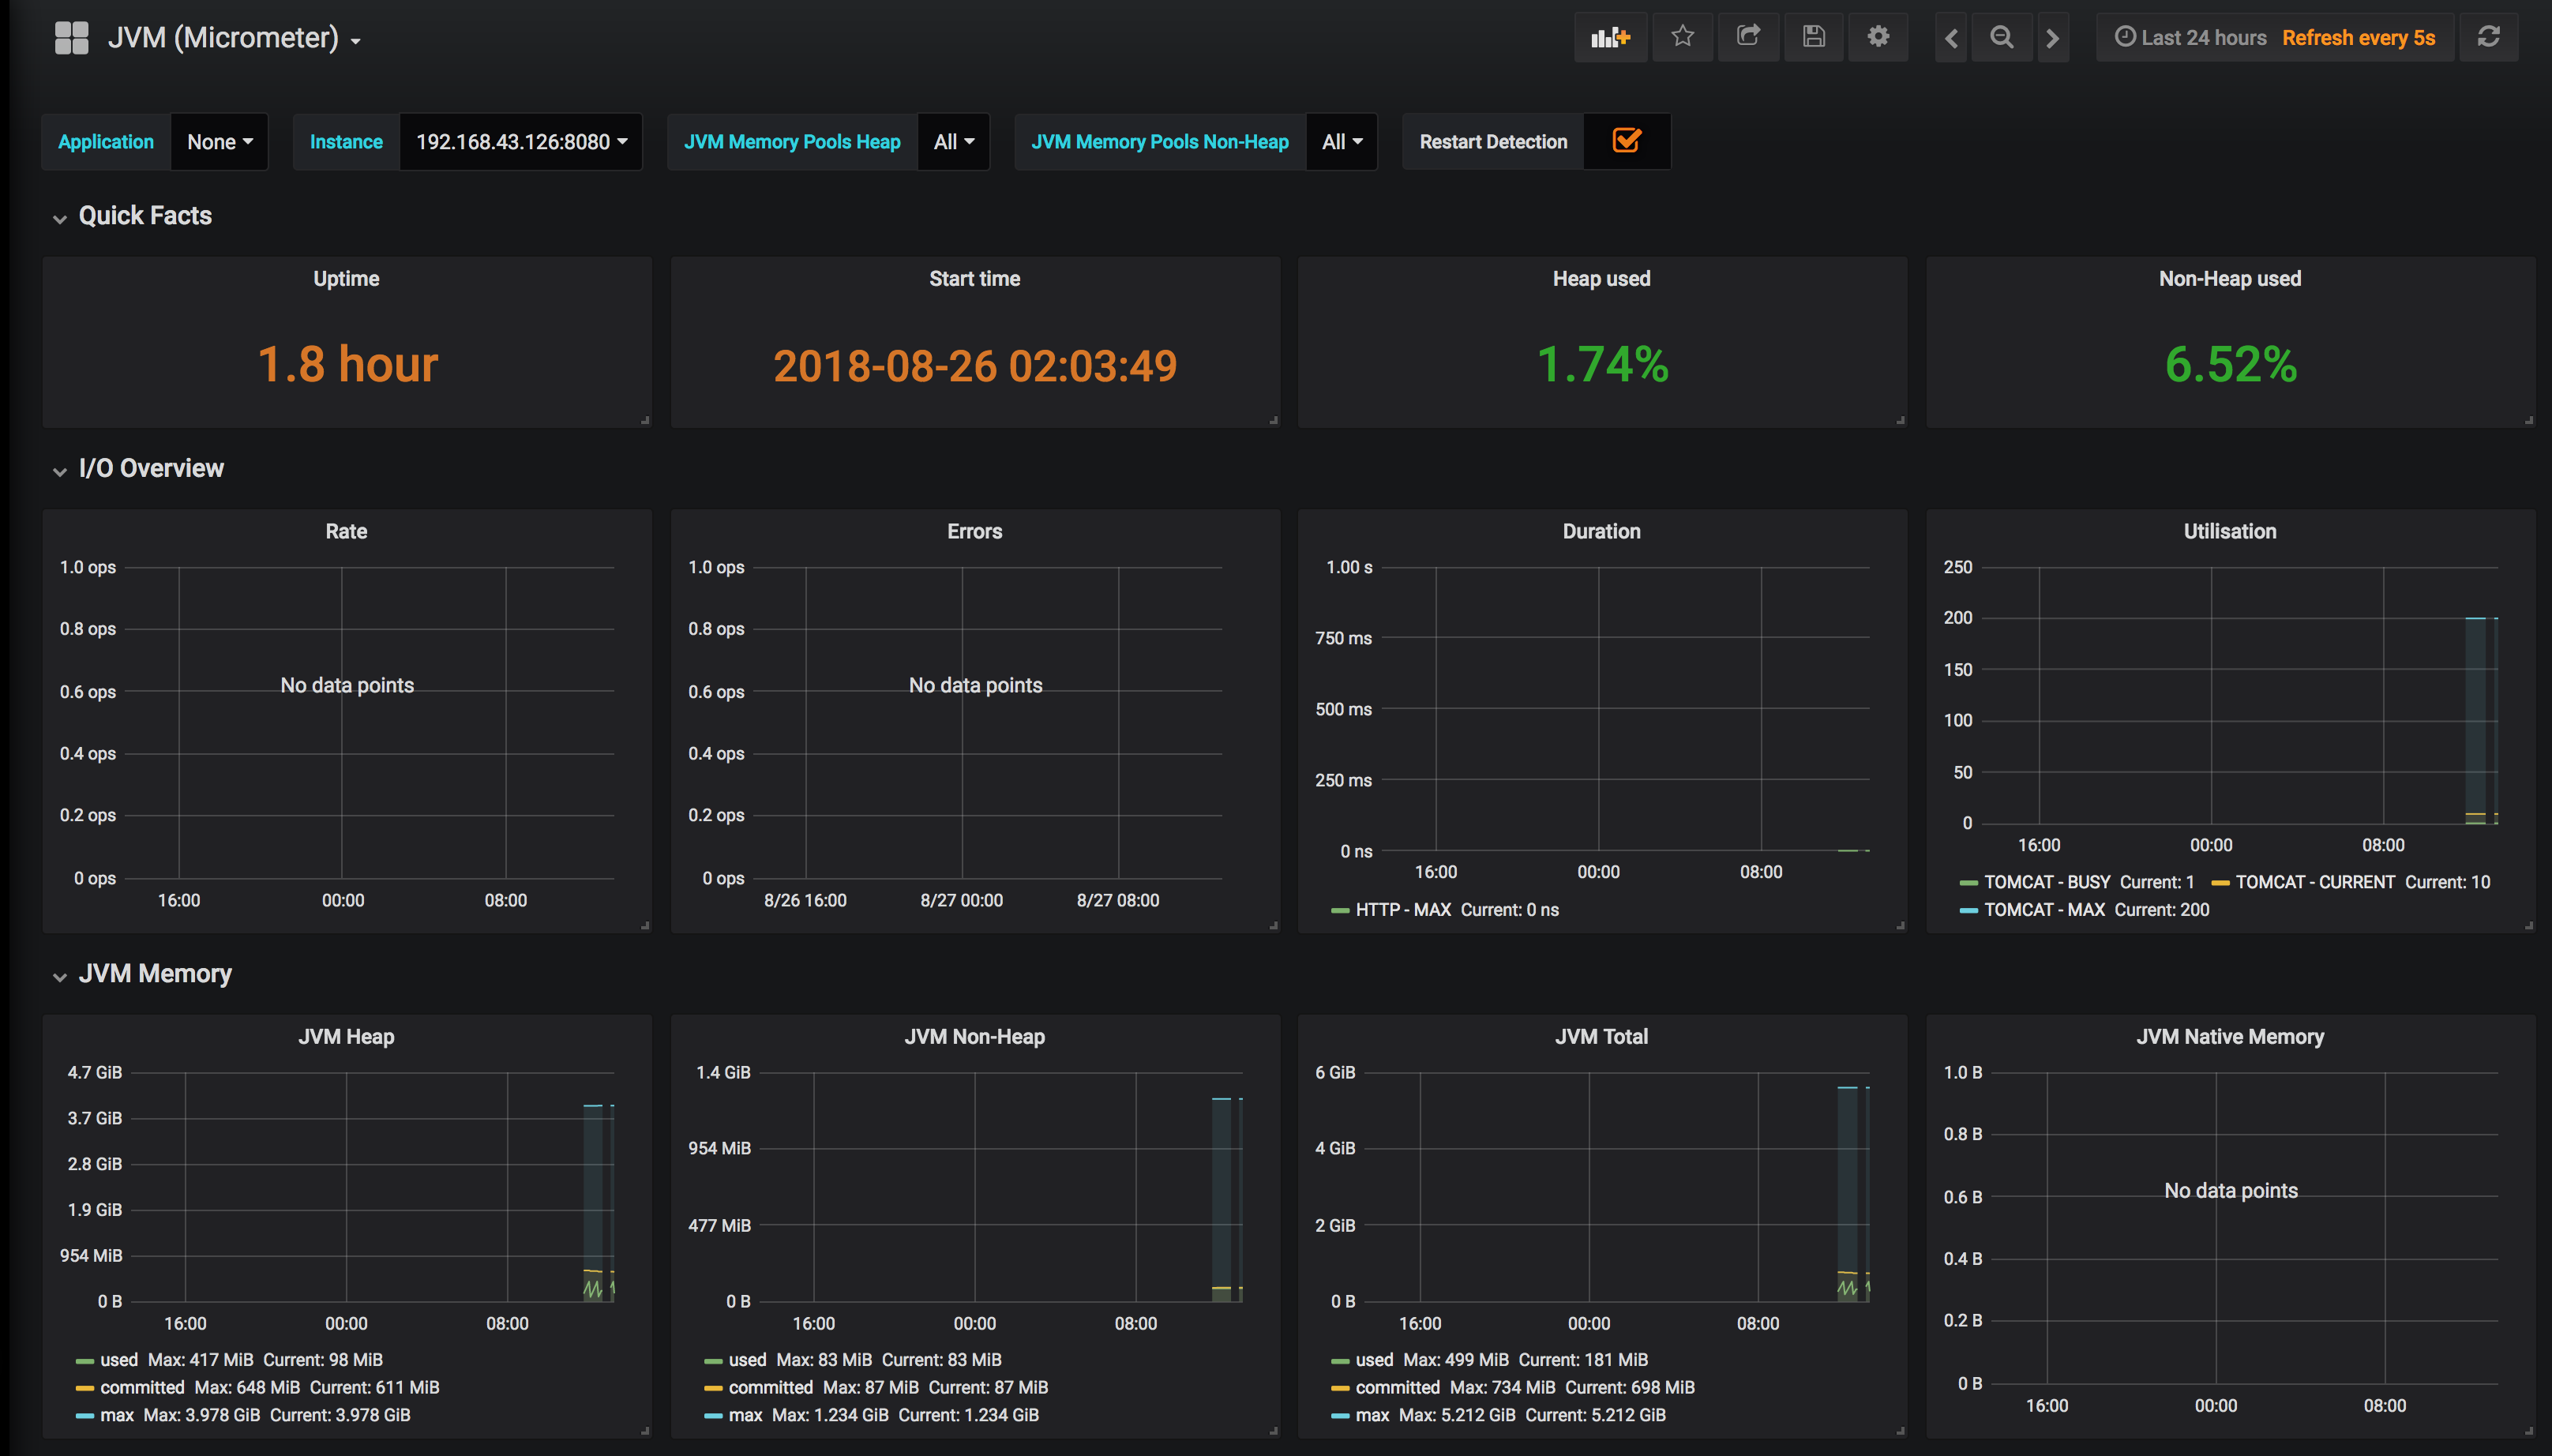
Micrometer JVM Metrics Dashboard
To monitor your custom metrics or metrics that are not shown in the JVM metrics dashboard, you can create a new dashboard to add panels to it or change the JVM metric dashboard as adding new panels. When you add a new Grafana panel you should provide a PromQL query to this panel, for entity_count_total Prometheus metric the PromQL query is just the name of metric, you can add a panel like below for this metric;
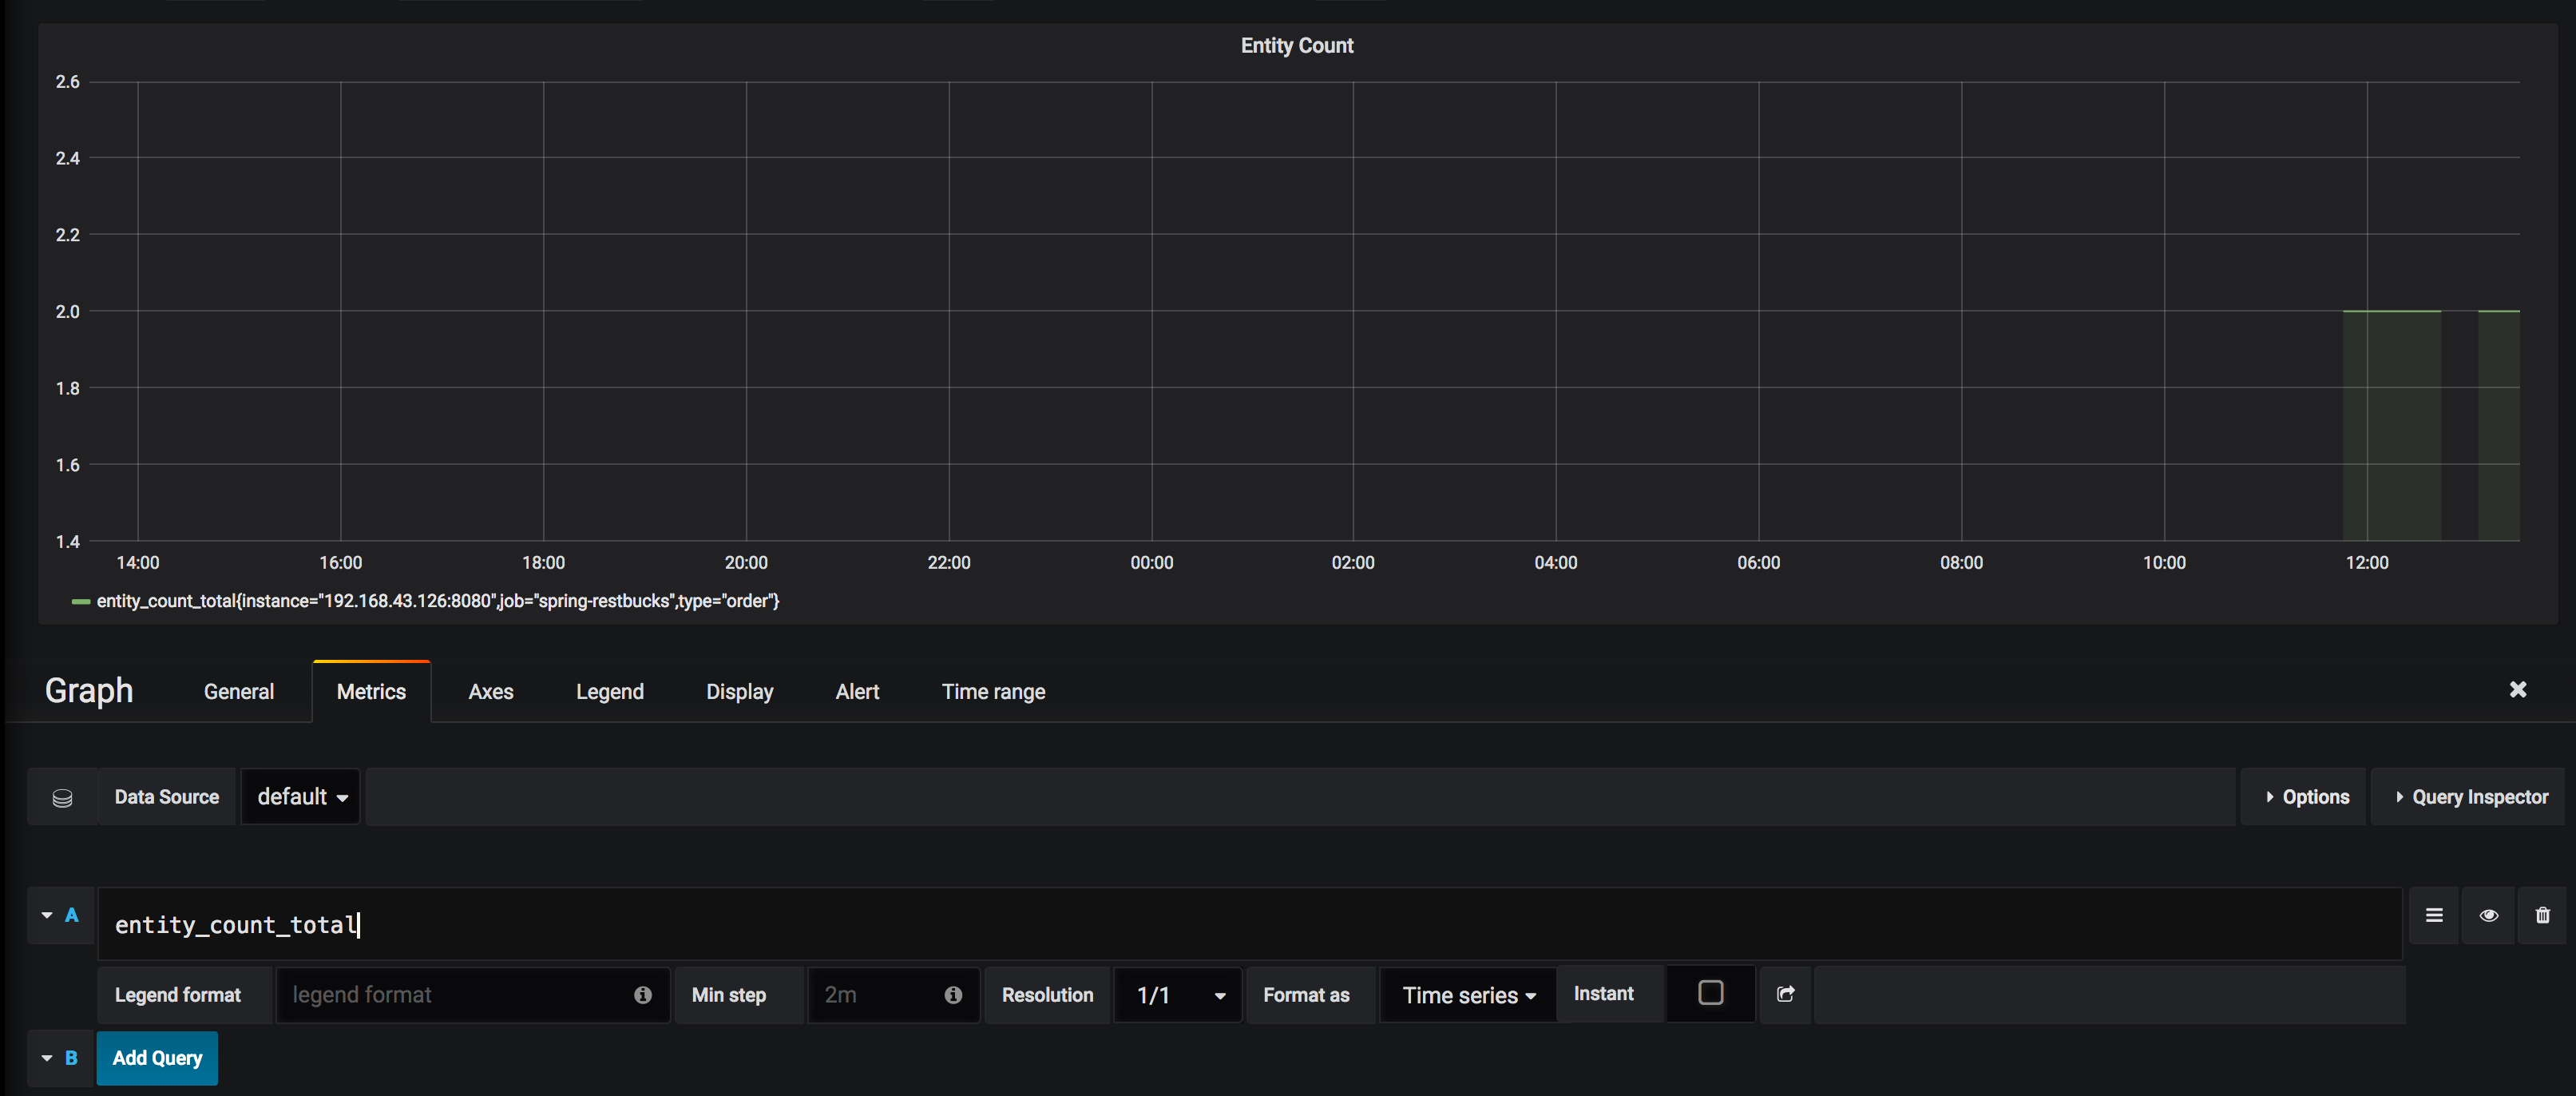
Add Panel For Entity Count Metric
Conclusion
I try to explain the very basic setups for producing and monitoring Spring Boot 2 application metrics in an end-to-end manner. Of course, there are many other configurations and usage of the tools Micrometer, Prometheus, Grafana, especially for production usage. If you have any comments please share with me via the comments section or Twitter.